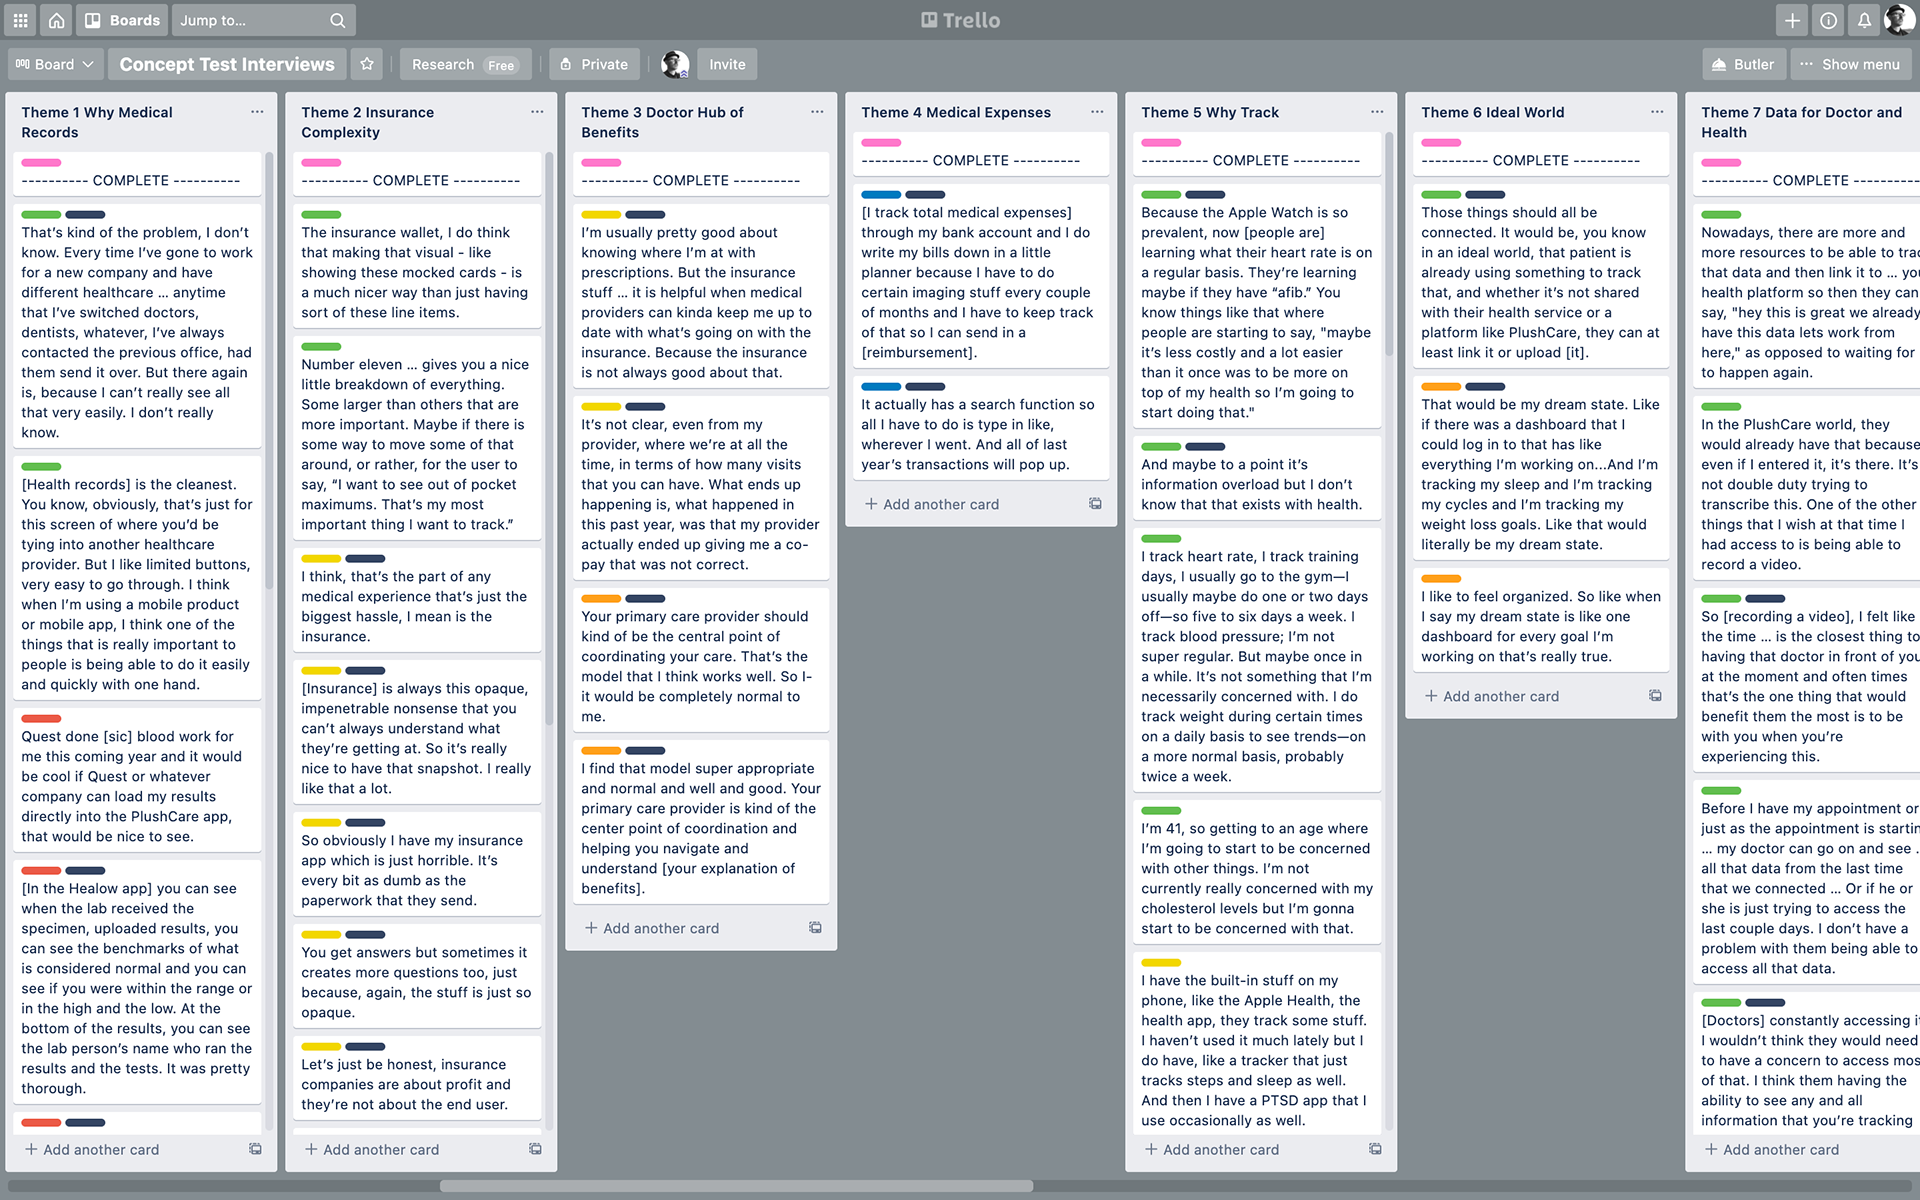
Themes identified during an analysis of qualitative data using Trello

This is the story of discovering a profound insight into user needs. While I was the lead user experience designer at PlushCare, a telemedicine provider for patients who want a same-day doctor's appointment and prescription, I discovered three meaningful user insights: 
1) Patients want a close and ongoing relationship with a doctor.
2) The convenience of medical records in one place relieves stress.
3) Having a service that manages insurance is a pain reliever, like medications.
The first insight in particular exposed an embarrassingly obvious gap in service that, if addressed, could remedy the problem of declining member retention. The research revealed that the company was not using its EHR (electronic health records) system to satisfy a critical user need: that many patients need to record and track their blood pressure. Implementing this would be the first step toward fulfilling a close and ongoing relationship with a doctor
In order to discover these insights, I conducted mixed-methods research for the Member Experience Team. This team was responsible for the engagement and retention of patients who subscribed to either a monthly or an annual membership. 
What is mixed methods?
Mixed-methods research is research that combines quantitative and qualitative methods (National Center for Biotechnology Information (NCBI)). An ethnographic research consultant (hire Charley; she's great!) followed foundational research with a quantitative survey that I used for this study. Following the survey, I implemented two qualitative methods: concept tests and interviews. This research study was also explanatory in nature. I sought to explain why we received the quantitative results with qualitative inquiries (OpinionX).
After defining the problem with the Member Experience Team, I conducted the research in five phases:
1) Define the hypotheses to investigate.
2) Survey members to obtain information on their behaviors and interests (quantitative).
3) Obtain member feedback with concept tests (qualitative).
4) Interview members in depth (qualitative).
5) Analyze results and discover insights (qualitative).
Along the way, we reviewed the survey findings and re-evaluated our hypotheses. Working with the team, we pivoted, rendered a hypothesis invalid, and defined a new hypothesis for further investigation.
Start: The Problem
Member retention was not improving. PlushCare was losing members at a troubling rate, not long after they signed up. Nearly half of paid members would leave after six months. Extrapolating from the rate of attrition, we projected nearly two-thirds would leave after one year.
With input from customer service, we had a reasonable suspicion that this business problem was the result of a user problem: members didn't understand the value of paying for an ongoing membership, in addition to a service fee. Like a well-written blog post with a high-bounce rate, the service was too good. PlushCare's doctors cured patients and they didn't need to come back nor pay an ongoing membership fee. Can you believe that telemedicine actually works? 
The goal was to increase one-year retention to 50%. 
Phase 1: The Hypotheses
With input from various internal sources, I worked with the team to develop three hypotheses for unmet user needs. If the company met these needs, we would potentially increase the value of the membership and improve retention. The three hypotheses were:
1) Members want to track and share data with their doctors.
2) Members want an online community to discuss healthcare.
3) Members want an insurance wallet to see service value.
Hypothesis 1: Members want to track and share data with their doctors.
We suspected one way to keep members engaged would be to integrate with their health and fitness tracking devices. After all, many people track daily activities and if users found value in sharing those daily activities, we might increase engagement and retention. This was also top-of-mind for members of PlushCare's leadership, who initiated a medical study with Fitbit in early 2020 (Fitbit). Based on prior survey results and anecdotal evidence, we suspected that members wanted to track and share data with their doctors.
We supported this with market intelligence that indicated about 1 in 5 adults in the United States wears a smartwatch or fitness tracker. That proportion increased for women and members of above average-income households (Pew Research Center). This happened to fit well with our user persona named Shelby (meet Shelby).
Percent of U.S. adults who say they wear a smartwatch or fitness tracker: 21% for all adults, 25% for women, and 31% for high-income households making $75,000 or higher annually. Data from the Pew Research Center, January 9, 2020.

Results of a Pew Research study indicate that about one-quarter of U.S. adults wears a smartwatch or fitness tracker.

Most patients came to PlushCare needing a prescription. Of all prescriptions, PlushCare's doctors prescribed medications for blood pressure the most frequently. So we knew that heart health was important to our patients. Additionally, it is well known that heart disease is the leading cause of death in the United States (Centers for Disease Control and Prevention (CDC)). Furthermore, high blood pressure, obesity, and inactivity are all major health risks for many Americans (CDC). We suspected a service that addressed these problems would benefit a large proportion of PlushCare's members.
Though smartwatches and fitness trackers are useful to those who want to combat obesity and improve heart health, most can't detect blood pressure. A blood pressure cuff is required to measure it (NCBI). Some newer smartwatches such as the Galaxy Watch 3 or Omron HeartGuide will now detect blood pressure, along with many consumer-grade medical devices.
Devices that measure blood pressure. The Apple Watch 6 and Fitbit Charge 4 measure activity, blood oxygen, heart rate, and heart rhythm but do not measure blood pressure. A $39 Beurer BM47 measures blood pressure and heart rate with a pressurized cuff.

Consumer devices that do and do not measure blood pressure.

Hypothesis 2: Members want an online community to discuss healthcare.
A PlushCare board member proposed a community feature, pointing to social media and online discussion groups where people shared information about their health and treatments. We didn't have much prior research to support this, so we guessed that members want an online community to discuss healthcare.
Hypothesis 3: Members want an insurance wallet to see service value.
We knew that members had trouble understanding the value of membership. Members without insurance got more value out of the membership because of flat-rate pricing and discounted return visits. Conversely, members with insurance usually paid a low copay and were reluctant to pay an additional membership fee. However, insured members were more valuable because the company could bill insurance payers at a higher rate. To complicate matters, some members were insured but chose to pay the flat-rate price out of pocket without using insurance. Senior leadership advocated capturing the insurance details from those with insurance who chose to pay out of pocket.
We brainstormed a way to communicate the membership value for both insured and uninsured members and made another guess that members want an insurance wallet to see service value. By the way, do you know what an insurance wallet is? Neither do I. No one does because it doesn't exist. I made up the concept for this project. Furthermore, we had to dig up secondary research to support this hypothesis. 
Phase 2: Member Survey
Why use a survey?
Surveys are an excellent tool to gather data on people's attitudes quickly. It's very exciting to see hundreds of responses pour in. Surveys are useful to determine if a product idea is on the right track. However, because surveys are attitudinal, often there is a difference between what people say and what people do (Nielsen Norman). Because of this, qualitative research must be done to explain why people provide the answers that they do.
Our ethnographic research consultant crafted an 80-question survey with nine questions specifically asking about tracking behavior. We then sent it to about 50,000 current members, inviting participants to complete the survey with a chance to win a $100 gift card. We received 660 unique responses, which was large enough to validate our hypotheses.
Findings
In the survey, we asked respondents if they tracked any aspect of their health. Nearly three-quarters of our respondents self-reported that they tracked some aspect of their health. These data continued to support our first hypothesis: members want to track and share data with their doctors.
Of 660 members surveyed, 487 actively track some aspect of their health. 74% track health.

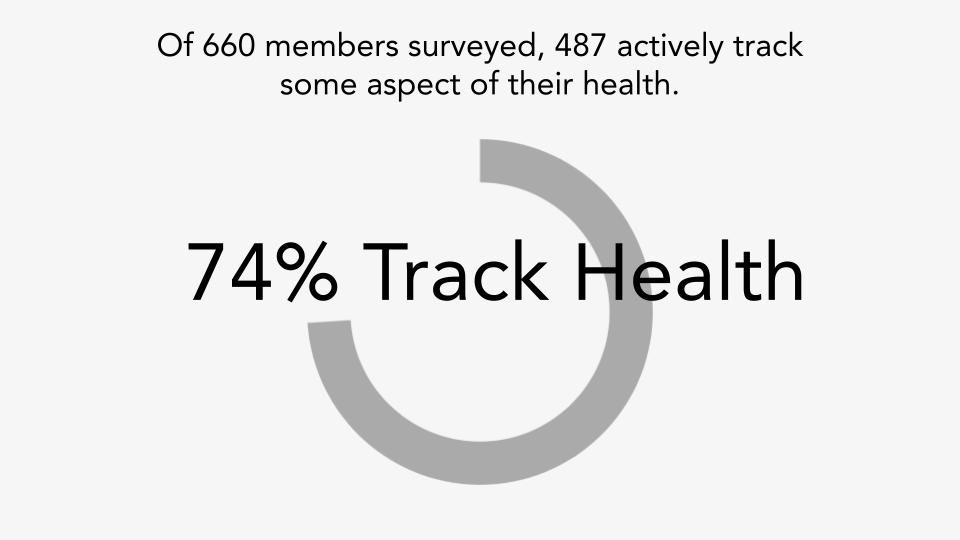
Nearly three-quarters of members surveyed tracked some aspect of their health.

We also asked them to rate their interest in other features. Half of our respondents were very interested in the ability to track and share information with their care team, which continued to support our first hypothesis.
After comparing interest in various other features, something stood out. Our respondents were not nearly as interested in online communities as they were in another proposed feature: access to full medical records in one place. Huh, what's that about? This didn't bode well for our second hypothesis: members want an online community to discuss healthcare. 
Nearly half of the respondents wanted that undefined thing called an insurance wallet as well. With this evidence, we continued investigating our third hypothesis: members want an insurance wallet to see service value.
Members who indicated "very interest": 329 ability to track and share info with my care team; 477 access to my full medical records in one place; 321 insurance wallet; 167 online communities.

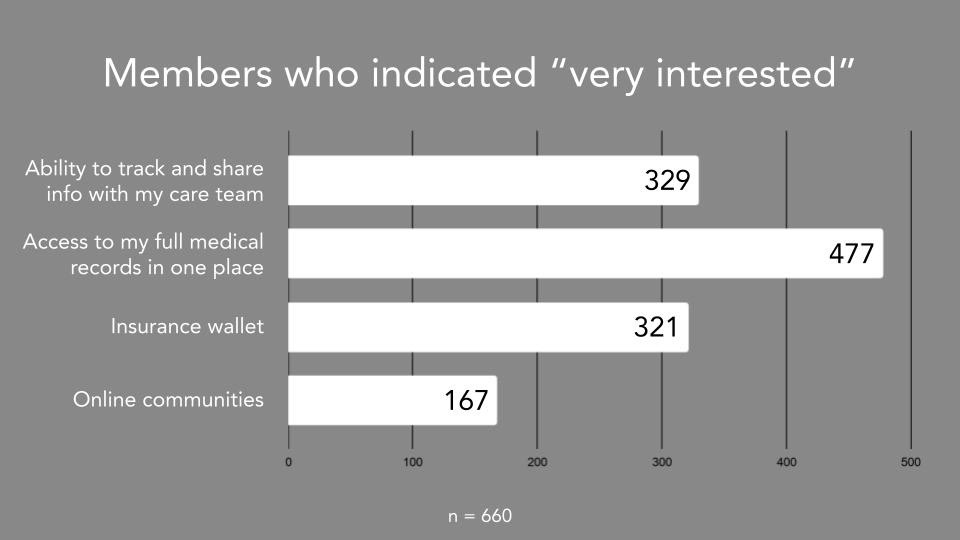
Members indicated they were "very interested" in access to medical records nearly three times that of online communities.

Pivot!
After seeing so many people interested in medical records rather than online communities, and after much debate, we took this opportunity to reject our second hypothesis and concluded that members don't want an online community to discuss healthcare. Sorry, Mr. Boardmember. We'll come back to your idea another time.
Given our ability to pivot quickly, we jumped on the opportunity to investigate a new hypothesis: members want access to full medical records in one place.
Phase 3: Concept Tests
What is a concept test?
A concept test is simply a way to ask participants which idea they like the most among a selection of options. Ideas are presented as images that represent screens of an app on a smartphone. Concept tests are a hybrid testing technique, that provides both qualitative and quantitative results (Nielsen Norman). With Usability Hub, I conducted remote testing that combined unmoderated preference tests (visual comparisons) with open-ended, free-text answers (similar to a structured interview), followed by survey questions (take the test). 
Participants
I used the survey respondents to recruit participants for the concept test. Of the survey respondents, I segmented them based on their self-reported behaviors and interests rather than their demographics. Marketing professionals are generally more interested in demographics and product designers rely on user behavior (Nielsen Norman). In lieu of directly observing behaviors, I used self-reported behaviors as a proxy.
After filtering responses for those who, 1) consented to be contacted, 2) answered "yes" to tracking any aspect of their health, and 3) answered "very" or "somewhat" interested in both "access to full medical records in one place" and the "insurance wallet," I ended up with 125 potential participants. I emailed an invitation to these participants, asking them to participate in the concept tests for a $5 gift card. Thirty-five participants responded, which is a fantastic response rate.

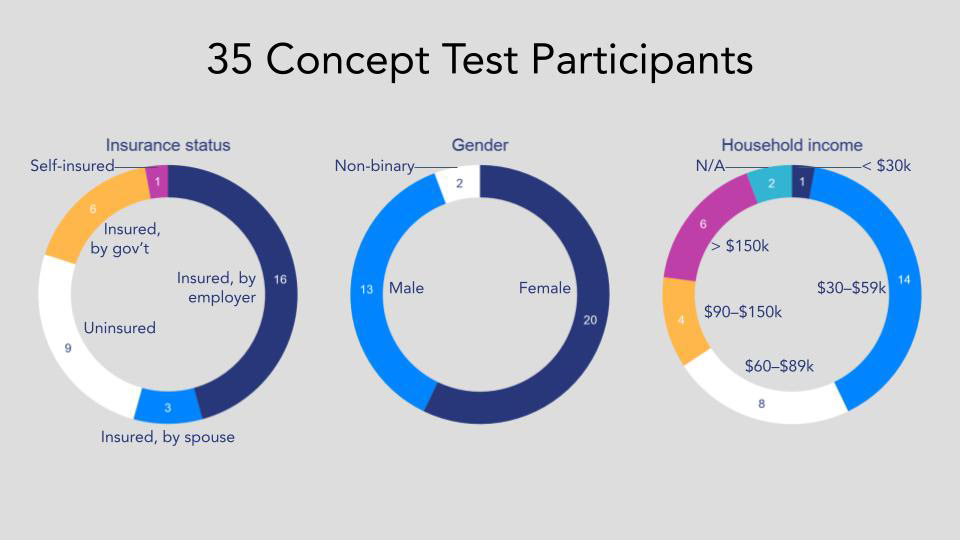
Demographic attributes of participants by insurance status, gender, and household income.

Three hypotheses, three themes, multiple variations
We matched each hypothesis to a specific mockup representing an associated theme: tracking, medical records, and insurance wallet. Participants were instructed to choose their preferred concept among the three themes and then were asked to choose secondary concepts among variations of each theme. I designed simple product mockups to represent the concepts, shown below (view all the mockups).
Mockups in iPhone frames depicting the 3 themes of medical records, tracking, and insurance wallet.

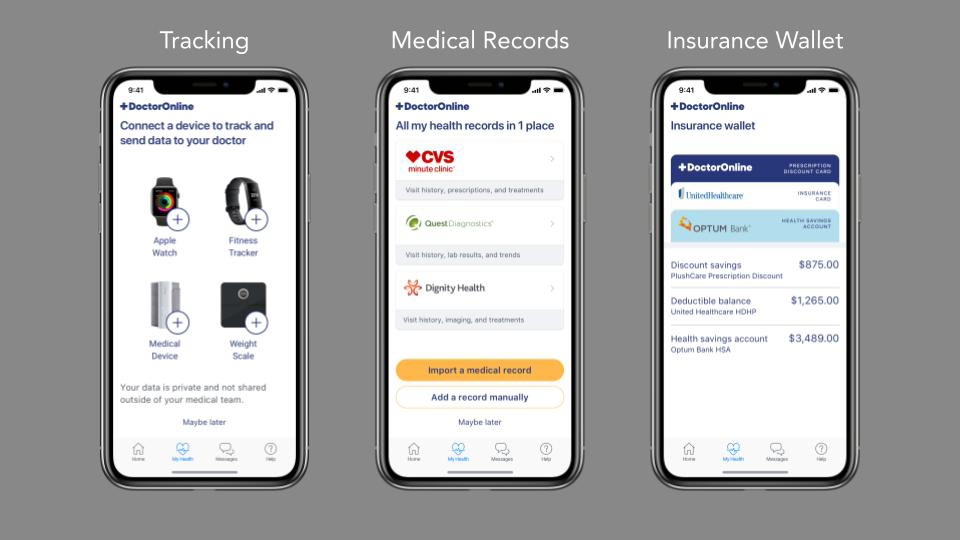
Three thematic concepts: medical records, tracking, and insurance wallet.

Mockups depicting variations of the 3 themes of medical records, tracking, and insurance wallet.

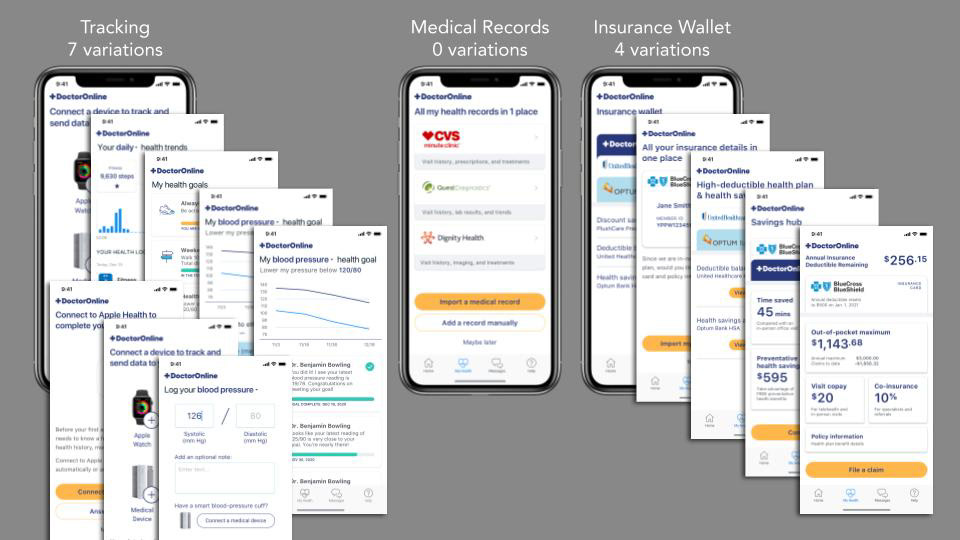
The variations provided within each theme.

Unexpected results!
Most participants preferred “All my health records in one place” over the other concepts. Huh? That's crazy! It's a good thing we pivoted away from online communities. Additionally, we found that a majority of participants preferred “Connect a device” among the tracking concept variations. I probed into this subject during the interviews to discover the most insightful results of this research.
The insurance wallet was the least preferred thematic concept. Despite that, participants overwhelmingly responded positively to seeing their "annual insurance deductible remaining.” This finding foreshadowed a significant pain point uncovered in the next phase of interviews.
Phase 4: Interviews
Why interviews?
Interviews help explain why people provide the answers they do in surveys and concept tests but much like surveys, interviews are attitudinal and thus prone to discrepancies between what people say and what people do (Nielsen Norman). The two reasons that I conduct user interviews are: 1) to listen to people tell stories and 2) to empathize with them. All of the findings and insights are secondary to these two intentions. I heard a lot of stories and felt their pain. Nobody's life is easy.

An interview in progress using Google Meet.

Participants
The concept tests in the previous phase conveniently served as a screener for these interviews. They allowed me to select members with a high level of expressiveness and articulation, based on the answers they provided. As a result, I was able to capture the most unique and meaningful stories, to inspire a high degree of empathy, and to provide significant insights.
After reading through and categorizing all of the participant comments in the concept tests, I invited 10 participants to interviews and included a $50 gift-card incentive. I recruited five participants. A general description of the participants is shown below. I blurred their names and faces to protect their privacy in order to comply with HIPAA privacy laws.

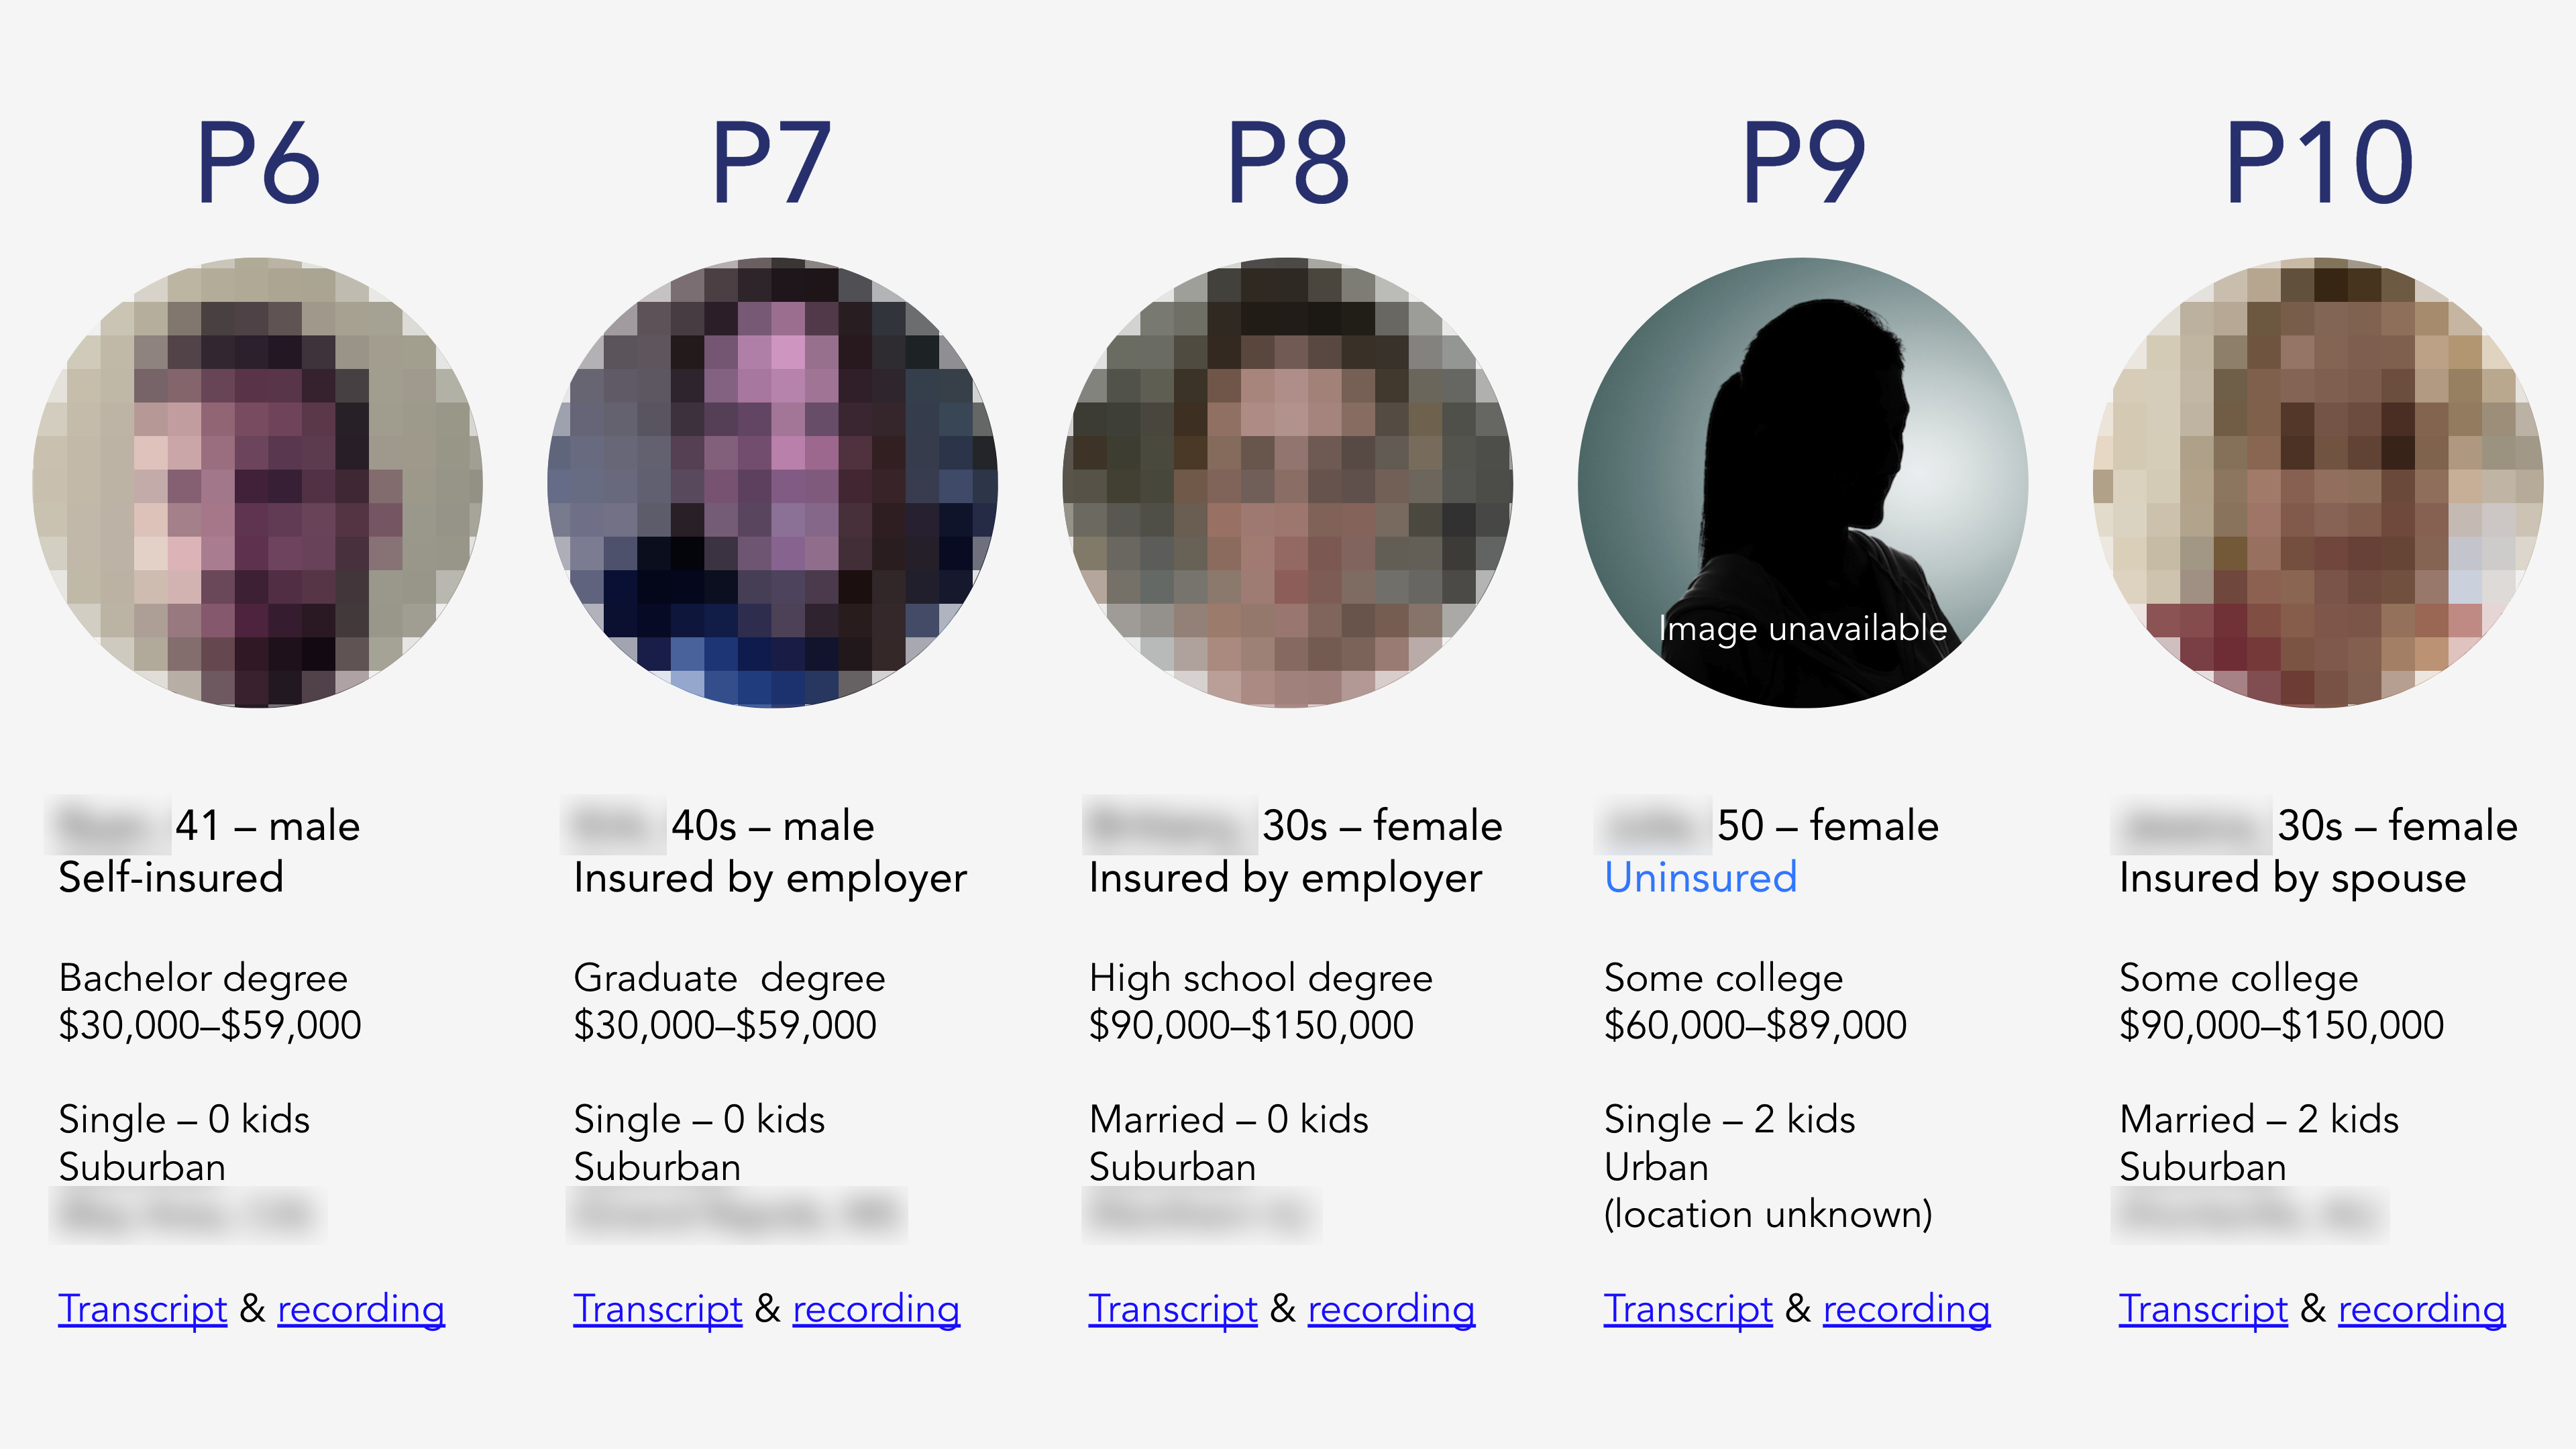
The five participants who agreed to an interview.

Interviews
With zero no-shows or substitutions (that's commitment!), I conducted the five remote interviews via Google Meet. They were 30-minute, semi-structured interviews that were recorded with the participants' consent. Afterwards, PlushCare staff volunteered to transcribe the recordings for analysis.
I had the good fortune to meet five people of various backgrounds and situations, each with a unique and painful story to share. P6 suffered from debilitating cluster headaches, P7 lived with PTSD, P8 had chronic insomnia, P9 was a hard-working single mom who couldn't afford health insurance, and P10 was just trying to stay healthy enough to raise her family. Listening to these people had a lasting effect on me because they shared their suffering as patients. However, I was careful not to probe too deeply into the nature of their medical conditions and I kept the interviews focused on questions related to our hypotheses.
Phase 5: Insights
Analysis
With nearly 48 pages of transcripts, I had the delightful challenge of analyzing the results quickly. Borrowing a technique invented at Pivotal Labs, I cut quotes out of the transcripts and pasted them into Trello cards, which allowed me to organize them into themes. This method is also conducive to collaborative analysis but I performed it alone. This is a visual way to code quotes, without using a strict coding method. I discovered 15 themes, which allowed me to easily uncover insights and tell the stories of these people using their own words.
Screenshot of a Trello board, featuring quotes copied onto movable cards.

Trello board with raw quotes arranged by participant, ready for thematic grouping and analysis.

Insight: Get to know me
All five participants wanted to share data with their doctors. They told me stories of how they tried doing this in the past: submitting journal entries by email, taking pictures of blood-pressure logs and uploading the images, and showing their progress to their doctors using apps that tracked moods, sleep, or ovulation. 
This further validated the hypothesis that members want to track and share data with their doctors. The deeper insight here was not that patients wanted to share data, it was that they wanted to enjoy a close and ongoing relationship with their doctor. A few participants wanted their doctor to provide feedback on goals. A couple of participants went so far as to suggest that a doctor should proactively intervene if there was an alarming trend, especially if they were tracking blood pressure.
Quote from P6: "[This] is showing me that, ‘Hey, Dr. Benjamin is connected to this. He’s seen this.’ There’s some confirmation that I’m entering this and it’s actually being accessed. So that feels good. I think more people would be better patients if they had more tools and resources to interact and engage with their healthcare provider. You can go on the PlushCare website, enter in notes how you feel, and you can record a quick video describe how you’re feeling. [That would be] the closest thing to having that doctor in front of you, at the moment, and often times that’s the one thing that would benefit them the most, is to be with you when you’re experiencing this."

A direct quote from a participant about receiving feedback from a doctor outside an appointment.

Insight: All in one place
A pattern emerged regarding medical records. Participants repeated the phrase “all in one place” numerous times. A few shared a common complaint of having to obtain prior records from other doctors to submit to current doctors. Additionally, some shared a concern about knowing what the records were for reference. 
This validated our hypothesis that members want access to full medical records in one place. It also suggested a need to unify and integrate medical records across numerous providers, past and present, but not because members really cared about tracking down records. The deeper insight was that it relieved stress—it cured that nagging feeling of not knowing where something was.
Quote from P9: "[After my husband died] I had to set up everything in my phone and it became one place for everything. With that being said, if the PlushCare app had all my records in one place, it would feel complete." Quote from P10: "I had to go and get a giant thick file of all my old files and you know [laughs], which was really just a pain. You know, brought them myself to my new doctor and you know, they were weird about it because they wanted it to be done digitally."

Direct quotes from participants about having medical records all in one place.

Insight: My insurance hurts
Just like a tummy ache or a headache, insurance hurts! Participants shared stories of the problems they had understanding insurance. One of the most important details that these participants cared about was the annual insurance deductible. 
This validated the hypothesis that members want an insurance wallet to see service value. Having insurance details available was great but the deeper insight was that patients expected medical providers to take care of their insurance needs as much as they expected them to take care of their medical needs. Having that service was a pain reliever, much like taking medications.
In the words of participants, insurance is: dumb, hassle, hate, wrestle, and stress.

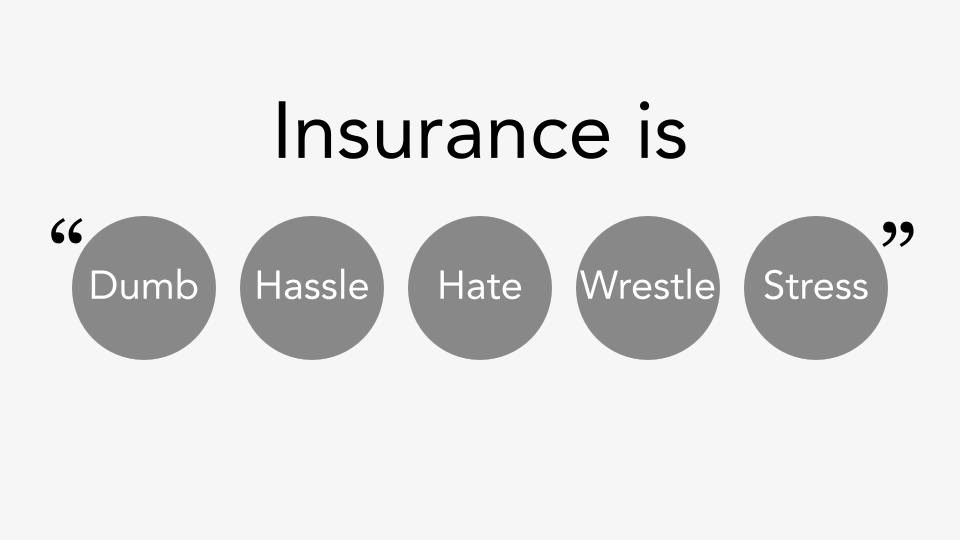
Words participants used to describe their insurance.

An Embarrassingly Obvious Discovery

D'oh! We have all this fancy technology and people are still using pen and paper? I discovered that two of our participants were writing their blood pressure readings down on paper for their telemedicine appointments with remote doctors! One went so far as to take a picture of it in order to upload it to her doctor. This is a profoundly inefficient way to send data to a doctor. 
The embarrassing thing isn't what we discovered but rather knowing that the company's EHR (electronic health record) system was already implemented to accept this information. It just wasn't exposed to members. Only once, during the appointment booking process, did members have an opportunity to enter this information as part of their current vitals.
What if PlushCare could make entering and sending this data to the doctor quick and easy? An obvious solution to a significant user need that would affect a large number of users and engage them on a regular basis was this: give members a way to enter their blood pressure readings and allow them to track trends over time! 
iPhone screen shows a way to log blood pressure readings as a way to replace pen and paper logs.

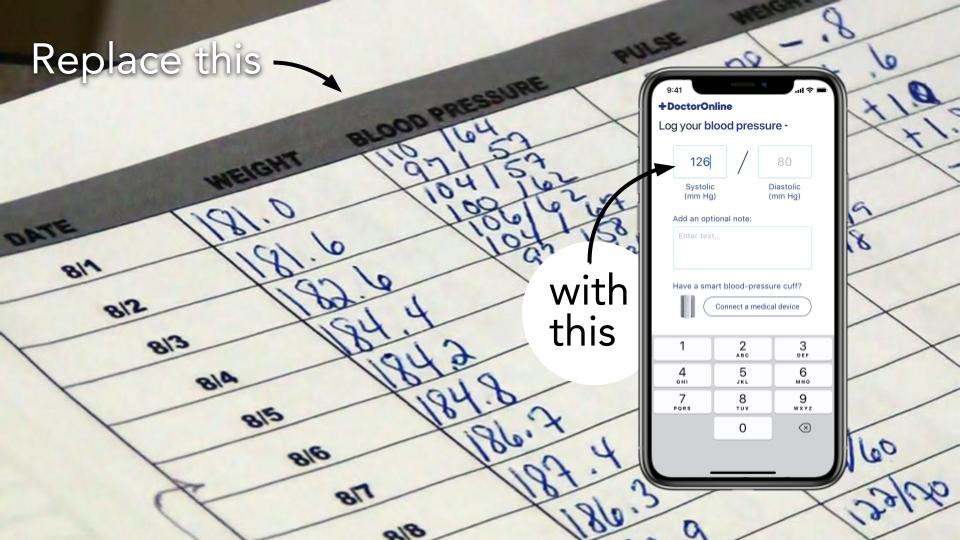
A digital product to record and track blood pressure could replace pen and paper logs.

This story ends with the profound insight that a simple solution could have a tremendous impact without being overly complicated. No fancy integration with connected devices or apps was necessary. The company just needed to make what was already implemented accessible to members on a regular basis.
Back to Top